Volumetric analysis with UAS Data
In a previous lab, I completed some ESRI tutorials regarding raster data analysis. This time, I engaged in raster data analysis using UAS data gathered over the course of a mine dredging operation.
I needed to draw upon what I've learned in the ESRI tutorials so far.
· Extract by mask
This tool extracts the cells of a raster that
correspond to the areas defined by a mask. The mask is typically a raster
dataset where cells with a certain value represent the areas I want to extract.
· Resample
Resampling is the process of
changing the resolution of a raster dataset.
· Surface volume
The Surface Volume tool
calculates the volume between two surfaces.
I began on the 4th
of July to where the mine operation tells of the dredging to take place, and
for me to establish a base dataset to know how much material was added. They
are also concerned about slope failure and low lying flat areas where water
will collect. Because the area flown is pretty large, I cliped out
the area to work with.
· Begin by getting
familiar with the data. Drag the following datasets into your project:
o
dsm_20170704
o
ortho_20170704
o
dsm_20170722
o
ortho_20170722
o
dsm_20170827
o
ortho_20170827
o
Dredgepile_clip
· Turn each feature on and examine the patterns. (Turn off the feature after viewing) Also look at the properties for each feature regarding their projection, linear units, and cell size. (Hint: use the swipe tool to compare datasets between dates)
|
Dataset |
Cell
size |
Projection |
Highest
elevation |
Lowest elevation |
|
dsm_20170704 |
0.020029, 0.020029 |
Transverse
Mercator |
254 |
225 |
|
dsm_20170722 |
0.01996, 0.01995 |
Transverse Mercator |
261 |
219 |
|
dsm_20170827 |
0.01937, 0.01937 |
Transverse Mercator |
286 |
204 |
·
To do analysis, I needed t to work with just the dredge pile of the operation. I engaged in
an extract by mask. I started with the dsm_20170704 raster layer.
o
Input raster:
dsm_20170704
o
Input raster or feature
mask data: Dredgepile_clip
o
Output raster: dsm_20170704_clipped
(Make sure this goes into your geodatabase)
·
What is the new high and
low elevation? How does this compare to the previous raster? Why did the
appearance change? Write your answer below
The new high elevation is 244
and the new low elevation is 225. New low elevation is almost same with the
previous raster, but new high elevation is smaller than the previous raster.
The appearance of the clipped
raster may change due to the removal of areas outside the Dredgepile_clip
polygon. This polygon likely represents the area of interest, such as the
dredge pile, and the extraction by mask operation has isolated this area for
analysis.
·
Open the tool the resample
tool within your geoprocessing tools. Click on the small blue i next
to the resample technique. In the space below describe each one.
·
NearestNeighbor—Performs a nearest neighbor assignment
and is the fastest of the interpolation methods. It is used primarily for
discrete data, such as a land-use classification, since it will not change the
values of the cells. The maximum spatial error will be one-half the cell size.
·
Bilinear—Performs a bilinear interpolation and
determines the new value of a cell based on a weighted distance average of the
four nearest input cell centers. It is useful for continuous data and will
cause some smoothing of the data.
·
Cubic—Performs a cubic convolution and determines the
new value of a cell based on fitting a smooth curve through the 16 nearest
input cell centers. It is appropriate for continuous data, although it may
result in the output raster containing values outside the range of the input
raster.
· Majority—Performs a majority algorithm and determines the new value of the cell based on the most popular values within the filter window. It is mainly used with discrete data, just as the nearest neighbor method; Majority tends to give a smoother result than Nearest. The majority resampling method will find corresponding 4 by 4 cells in the input space that are closest to the center of the output cell and use the majority of the 4 by 4 neighbors.
Based on the type of raster data I'm working with (elevation data), the two best resampling techniques for me to use are likely Bilinear and Cubic. These methods can help maintain the overall characteristics of the elevation data while reducing the cell size to a more manageable level for your analysis. Bilinear and Cubic interpolation provide a good balance between preserving detail and smoothing out noise in the data.
·
Now run the resample
tool with the following specifications:
o Input raster: dsm_2017_clipped
o X and Y cell size 50cm
o Resample technique: bilinear
o Output name: dsm_20170704_clipped_50cm
·
Now perform a raster
extract and resample for the following datasets:
o Dsm_20170722
o Dsm_20170827
·
Now generate a hillshade
for each of those datasets.
o Note the hillshade for the July 4th
data set has lots of noise. This presents issues with analysis, so we will not
being doing slope and aspect analysis with this dataset.
o The other two are good datasets, but we need to
do a few more tweaks before working on them.
·
Before we do analysis,
we are going to want to clean up the ‘noise’ on the July 22 and the August 27
datasets. (The July 4th one is beyond fixing) We are going to engage
in a fill operation on those to get rid of the noise on the ground. Open the fill
tool in geoprocessing
o Input surface raster: dsm_20170722_clipped_50cm
o Output surface raster: fill_20170722_25cm
o Z limit: .25
·
Now do the same thing
with the August 27th dataset


- On August 27th, the mine owner was worried about the extent of flooding at the bottom of the dredge pile. Looking at the orthomosaic shows that they created a holding area for the water. Clearly that area should be flat.
- Use your fill_20170827_25cm to
engage in an aspect analysis.
- Then use map calculator to
find all the flat areas.
- In working with the August 27 dataset, you noticed that water is collecting between 233 and 234 meters. You want to see if the containment area has this criteria.
- Use the fill_20170827_25cm
and map algebra to find all areas between 233 and 234 meters
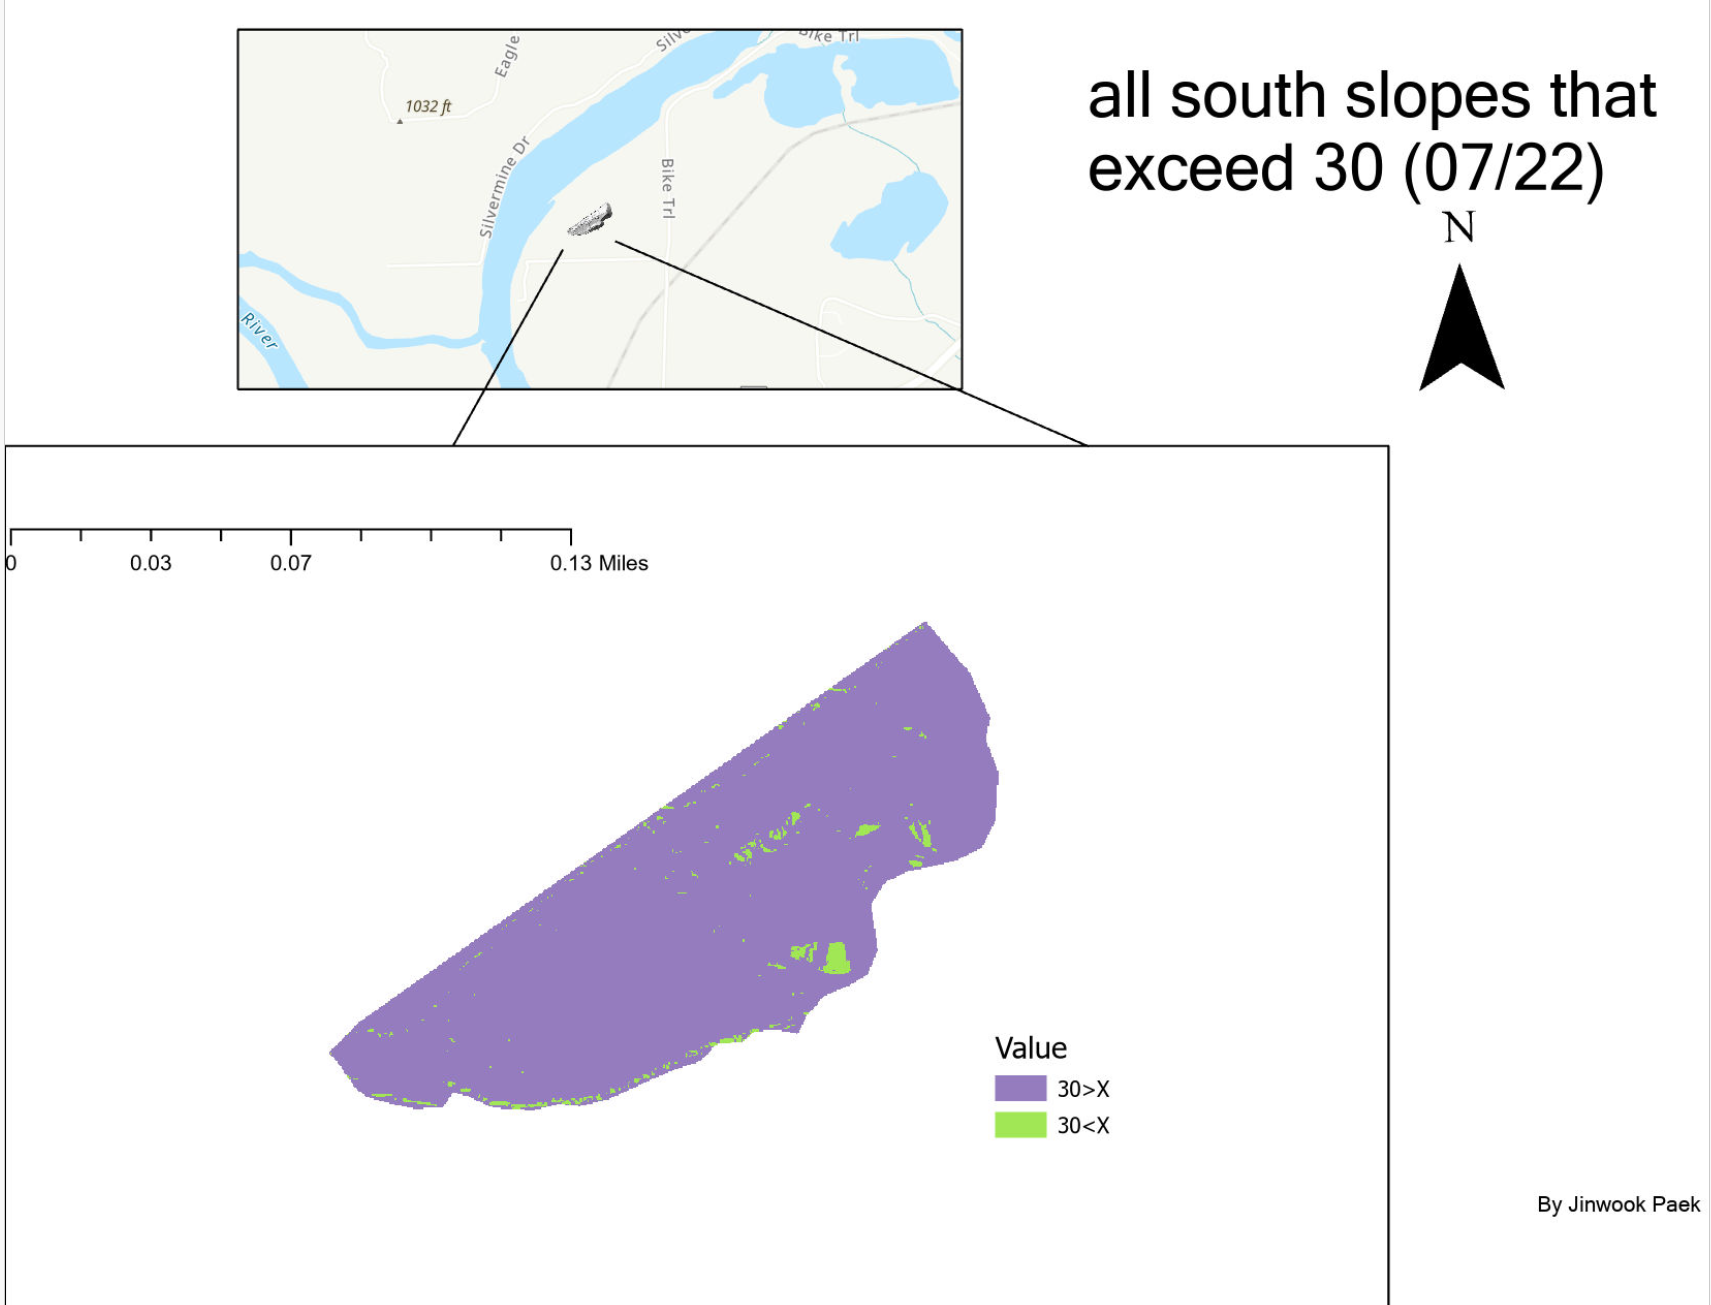
- By the time July 22 comes around, the dredge operation is well underway, and with that comes the risk of slope failure. If the material is wet, albeit not saturated, it tends to ‘stick’ and the slopes values are high. The issue is that as the material dries out, the slopes fail. Slope failure can occur on the pile when they exceed 30 degrees. We are mainly concerned about the south slopes that are above 30 degrees and want to get those smoothed out, or at least avoid them when conducting operations.
- Find out if the
pile is safe by locating all south slopes that exceed 30 degrees. (use
the fill_20170722_25cm)
- On August 27th the dredge pile has gotten pretty large. The mine is concerned about slopes on the upper reaches of the pile. They want to find out two things:
- How
much of the pile is more than 245 meters elevation. (use fill_20170827_25cm)
- In
that upper area, how much of the slope is more than 30 degrees. (use
fill_20170827_25cm)
- Although volumetric analysis has been going on this entire time, we want to get an idea of the changes that have occurred. We want to see how much of a difference there is on the pile between the August 27 date and July 22 and July 4. Generate the following new datasets: (Use the non-filled resampled to 50cm data sets)
- The
difference between July 22 and July 4
- The
difference between August 27 and July 4
- The difference between August 27 and July 22
- What
is the problem with this geoprocessing operation with the data we are
using? What ultimately needs to be done to effectively engage in this type
of analysis?
The main problem with this geoprocessing operation is that simply subtracting the elevation raster to get the difference in volume does not account for material being added or removed from the dredge pile. To effectively engage in this type of analysis, I need to have data on the actual volume of material added or removed from the pile between the dates of interest.


Comments
Post a Comment