Performing Line of Sight Analysis by Esri


In this step, I removed those lines of sight that are obstructed from viewing the parade route or that offer views that are too distant. In clear weather, 1,100 feet is the maximum distance to use for analysis.
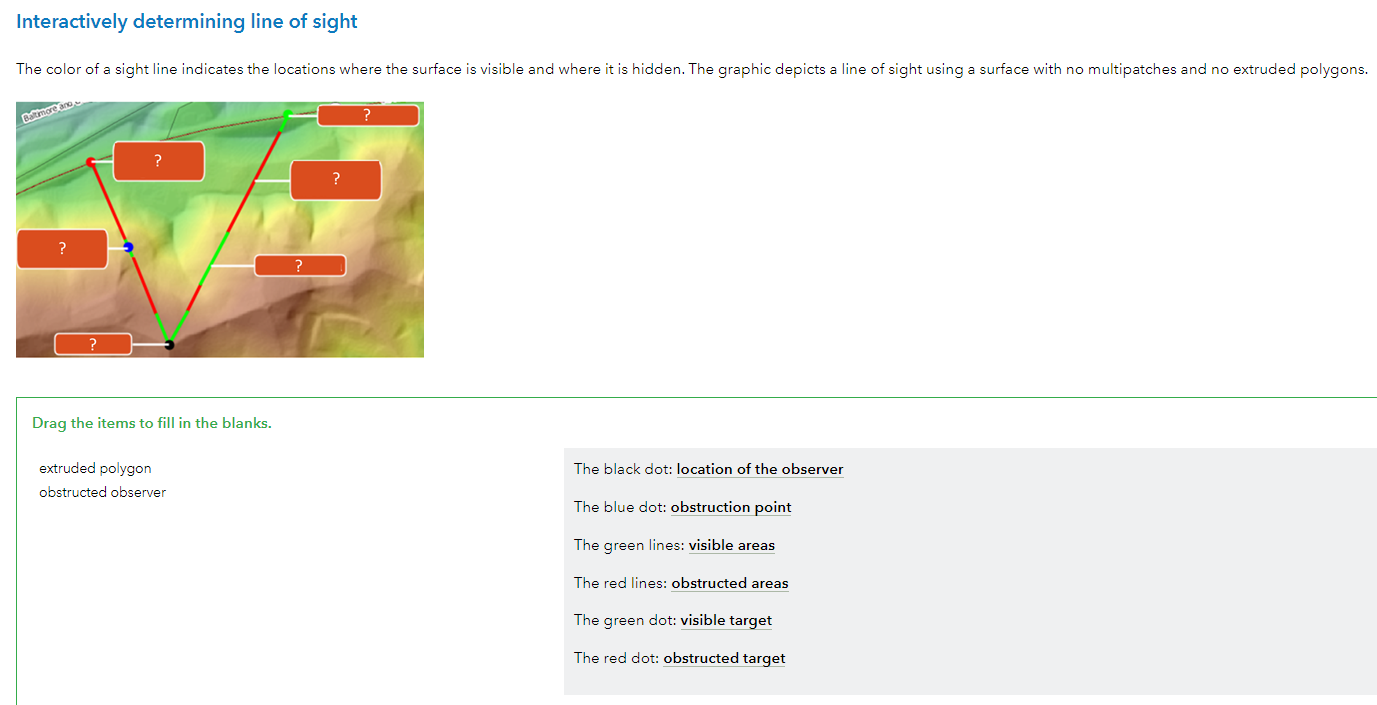
The TarIsVis attribute field was created when you ran the Line Of Sight tool. This field indicates target visibility along the line. A value of 1 indicates visible, and a value of 0 indicates not visible.
I used Select By Attributes to select the lines that are either not visible or that have a 3D length greater than 1,100 feet.
On the Map tab, in the Selection group, click Select By Attributes.
In the Select By Attributes dialog box, set the following parameters:
Input Rows: LOS_Lines
Selection Type: New Selection
Under Expression, build the following expression: Where TarIsVis Is Equal To 0.

The lines with obstructed views and the lines that are too long for good visibility are selected. after that, I deleted these lines.
In the Geoprocessing pane, find and open the Delete Features (Data Management Tools) tool.
Using this tool deletes the selected features from the input.
For Input Features, choose LOS_Lines.

One problem faced in surveillance is reduced visibility due to atmospheric conditions, such as rain, fog, and smog. In this step, I repeated my visibility analysis of the parade route, assuming a maximum visibility of 600 feet. A model has been created to automate the tasks performed in the previous steps.
From the Project tab, click Open, and then click Open Another Project.
In the Open Project dialog box, browse to ..\EsriTraining\ProLineSight and double-click LineOfSightAnalysis.aprx to open it.
In the Catalog pane, expand Folders, and then browse to ..\ProLineSight\Data\Philadelphia\VisibilityAnalysis.tbx.
Right-click the Parade Route Visibility model and choose Edit.


This time, the visibility distance excludes the lines of sight that are longer than 600 feet.
If necessary, to see the model clearly, on the ModelBuilder tab, in the View group, click Fit To Window .
In the ModelBuilder view, double-click Expression To Select LOS Lines.
The expression reads Where "TarIsVis" Is Equal To 0 OR "Length3D" Is Greater Than 600.
Close the expression box.
On the ModelBuilder tab, in the Run group, click Validate.
Validating the model ensures that all components are ready to run. Now you will run the model.
On the ModelBuilder tab, click Run.
As the model runs, each tool is highlighted in red as it executes. A progress pane tracks the geoprocessing operations.
After the model finishes running, close the progress pane.
Close the ModelBuilder view without saving changes.
Explore the parade route.
Comments
Post a Comment